› added 1 year ago
53

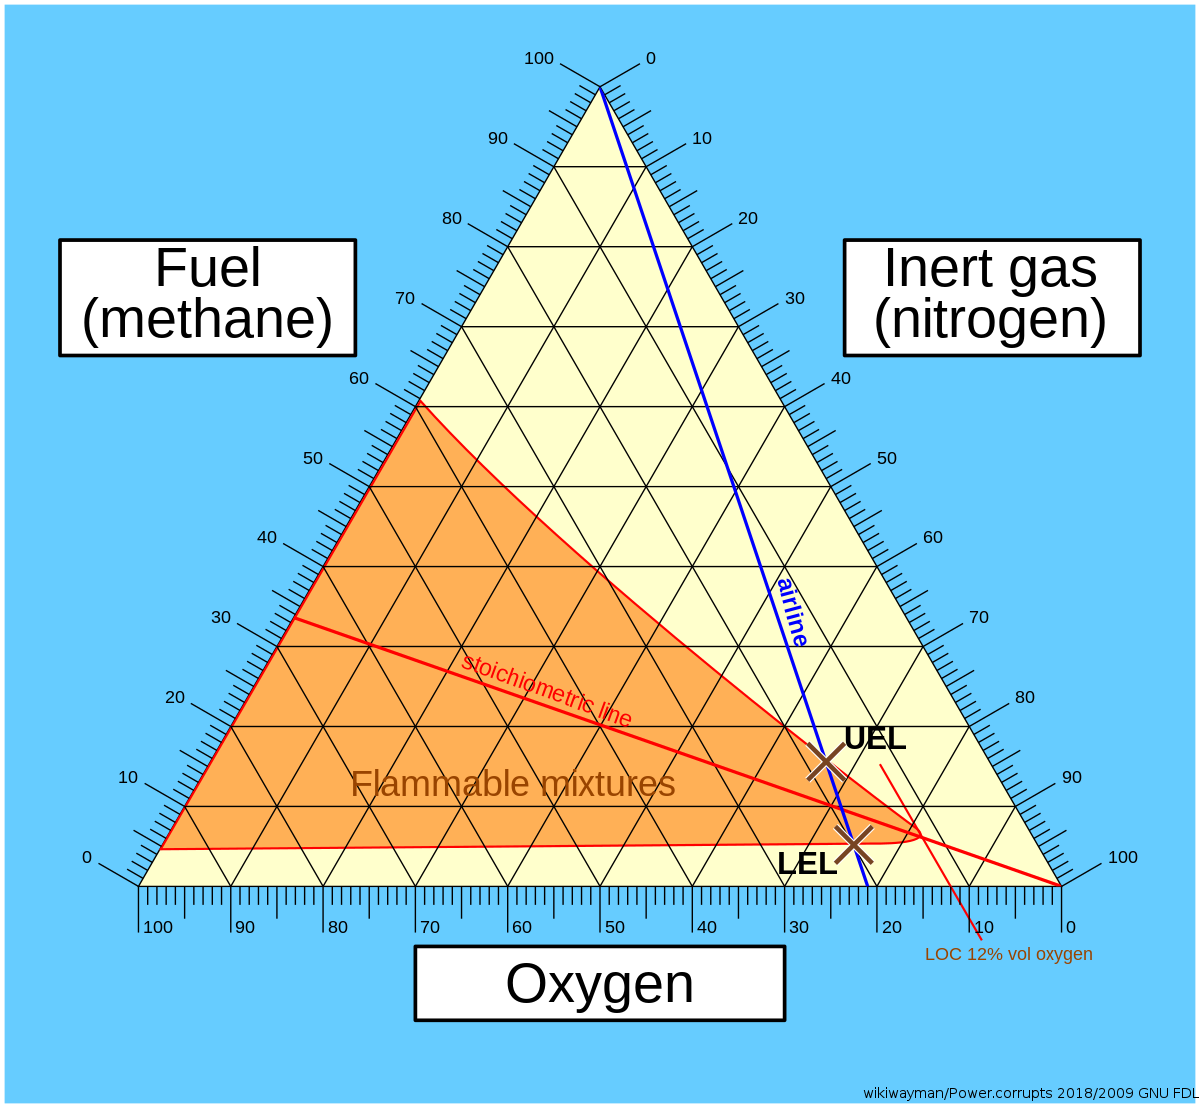
TIL about ternary plots. You can visualise 3 quantities on a 2d triangular graph if they add up to a constant (eg. soil components or colour composition). One graph is “x+y+z=1” which makes a triangle on positive axes, with the regular 3d gridlines intersecting to form triangular ones in the graph.