Markets
Map: Economic Might by U.S. Metro Area
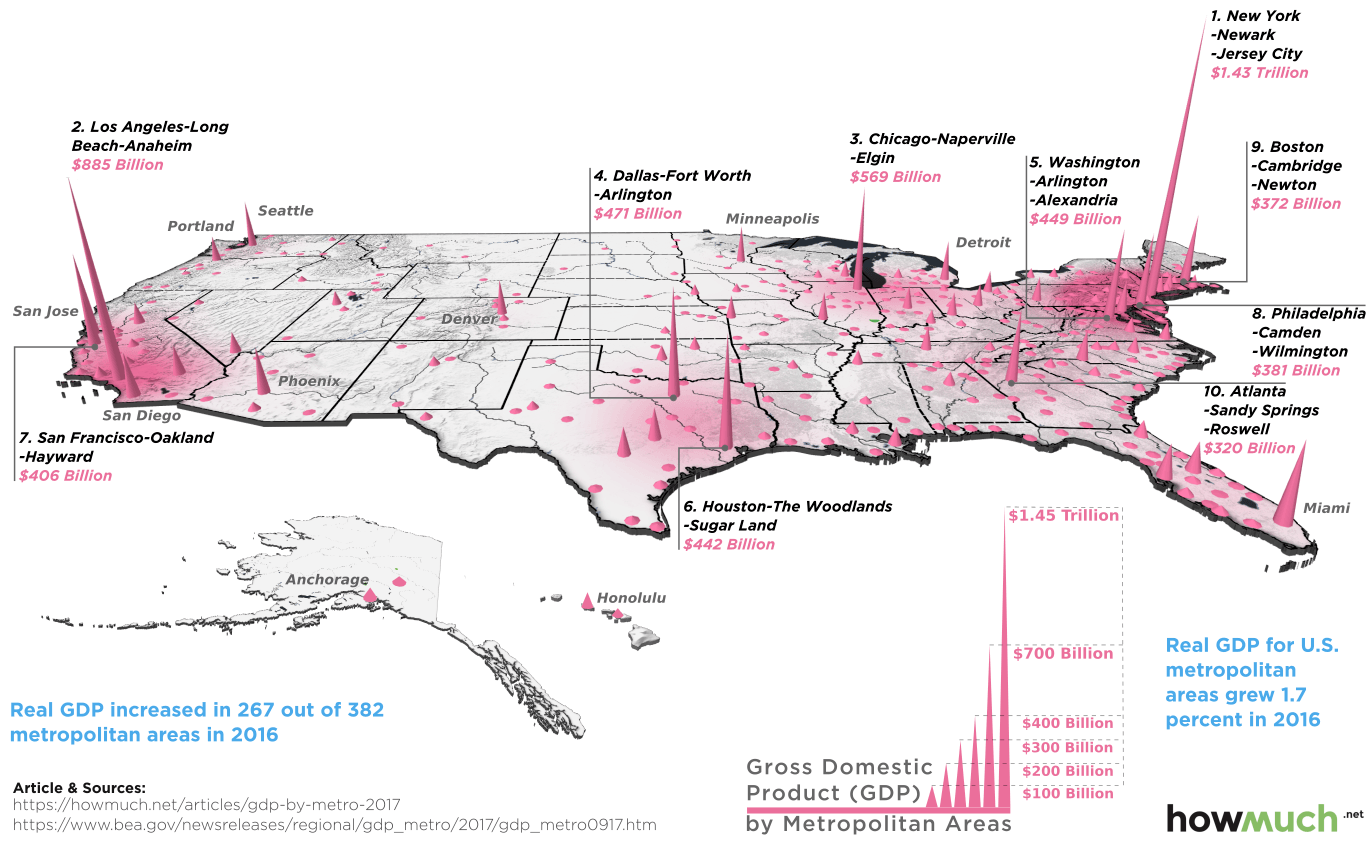
Map: Economic Might by U.S. Metro Area
The U.S. economy is massive on a global scale, and much of the country’s economic capabilities can be traced back to the innovation, knowledge, and productivity that tends to be clustered in urban areas.
The fact is that 80% of Americans live in cities – and the 10 largest metro areas alone combine for a whopping 34% of the country’s total GDP.
The 10 Largest Metro Areas by GDP
Today’s map comes to us from HowMuch.net, and it highlights recent data from the U.S. Bureau of Economic Analysis that estimates the GDP for each U.S. metro area in 2016:
| Rank | Metropolitan Area | 2016 GDP (Est.) | Population |
|---|---|---|---|
| #1 | New York-Newark-Jersey City, NY-NJ-PA | $1.43 trillion | 20.1 million |
| #2 | Los Angeles-Long Beach-Anaheim, CA | $885 billion | 13.3 million |
| #3 | Chicago-Naperville-Elgin, IL-IN-WI | $569 billion | 9.5 million |
| #4 | Dallas-Fort Worth-Arlington, TX | $471 billion | 7.2 million |
| #5 | Washington-Arlington-Alexandria, DC-VA-MD-WV | $449 billion | 6.1 million |
| #6 | Houston-The Woodlands-Sugar Land, TX | $442 billion | 6.7 million |
| #7 | San Francisco-Oakland-Hayward, CA | $406 billion | 4.7 million |
| #8 | Philadelphia-Camden-Wilmington, PA-NJ-DE-MD | $381 billion | 6.1 million |
| #9 | Boston-Cambridge-Newton, MA-NH | $371 billion | 4.8 million |
| #10 | Atlanta-Sandy Springs-Roswell, GA | $320 billion | 5.8 million |
| Top 10 Metropolitan Areas | $5.7 trillion | 84.3 million |
Note: figures in chained 2009 dollars
Not surprisingly, New York City and its surrounding area is the breadwinner here with an annual economic output of $1.43 trillion – the largest for any city in the United States. Impressively, the GDP of the NYC metro area is even higher than those of most of the world’s countries, including Australia, Mexico, and Spain.
It’s also interesting that some metro areas punch above their weight in relation to their population figures. San Francisco is #7 on the list with a GDP of $406 billion, despite having the lowest population total of all of the top 10. Boston and D.C. can be classified similarly, each with a high economic output per capita.
Trending Up, Trending Down
While they can’t quite compete with cities like New York and Chicago in terms of GDP or population, there are actually 300+ other metro areas in the country.
Here’s a recent snapshot from the BEA of which cities are growing – and which are shrinking in terms of GDP:
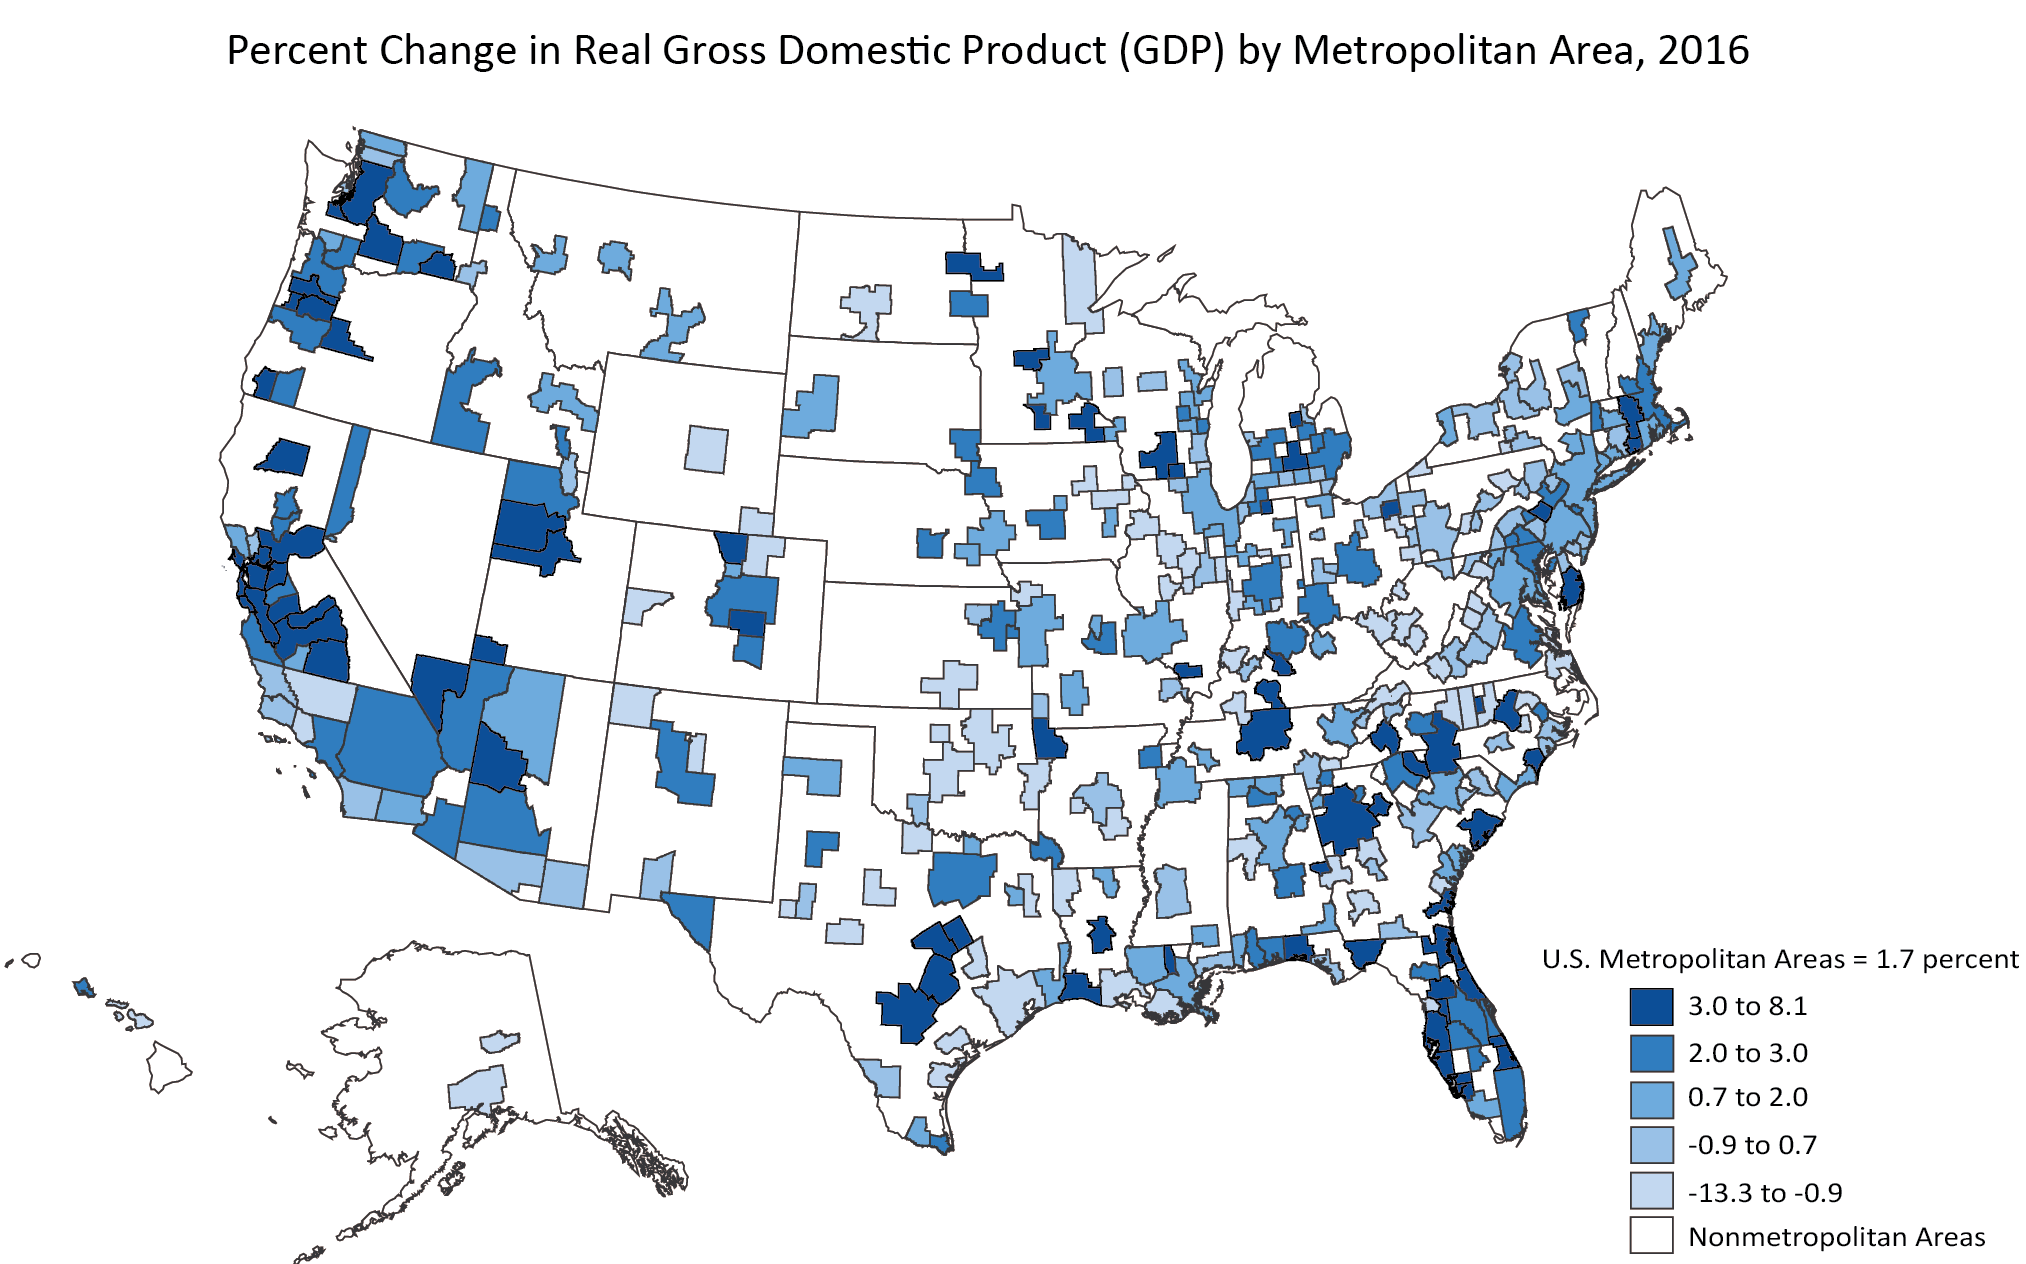
The BEA noted that real gross domestic product (GDP) increased in 267 out of 382 metropolitan areas in 2016.
The biggest increase was a tie between Lake Charles, LA and Bend-Redmond, OR, each which had GDP climb by 8.1% from the last year. The city that saw the biggest drop was Odessa, TX, which fell -13.3%.


United States
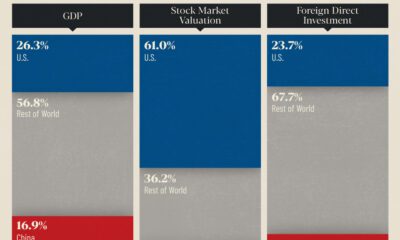
The World’s Largest Economies: Comparing the U.S. and China
How do the world’s two largest economies compare? We look at the economies of U.S. and China across GDP, stock markets, and FDI.
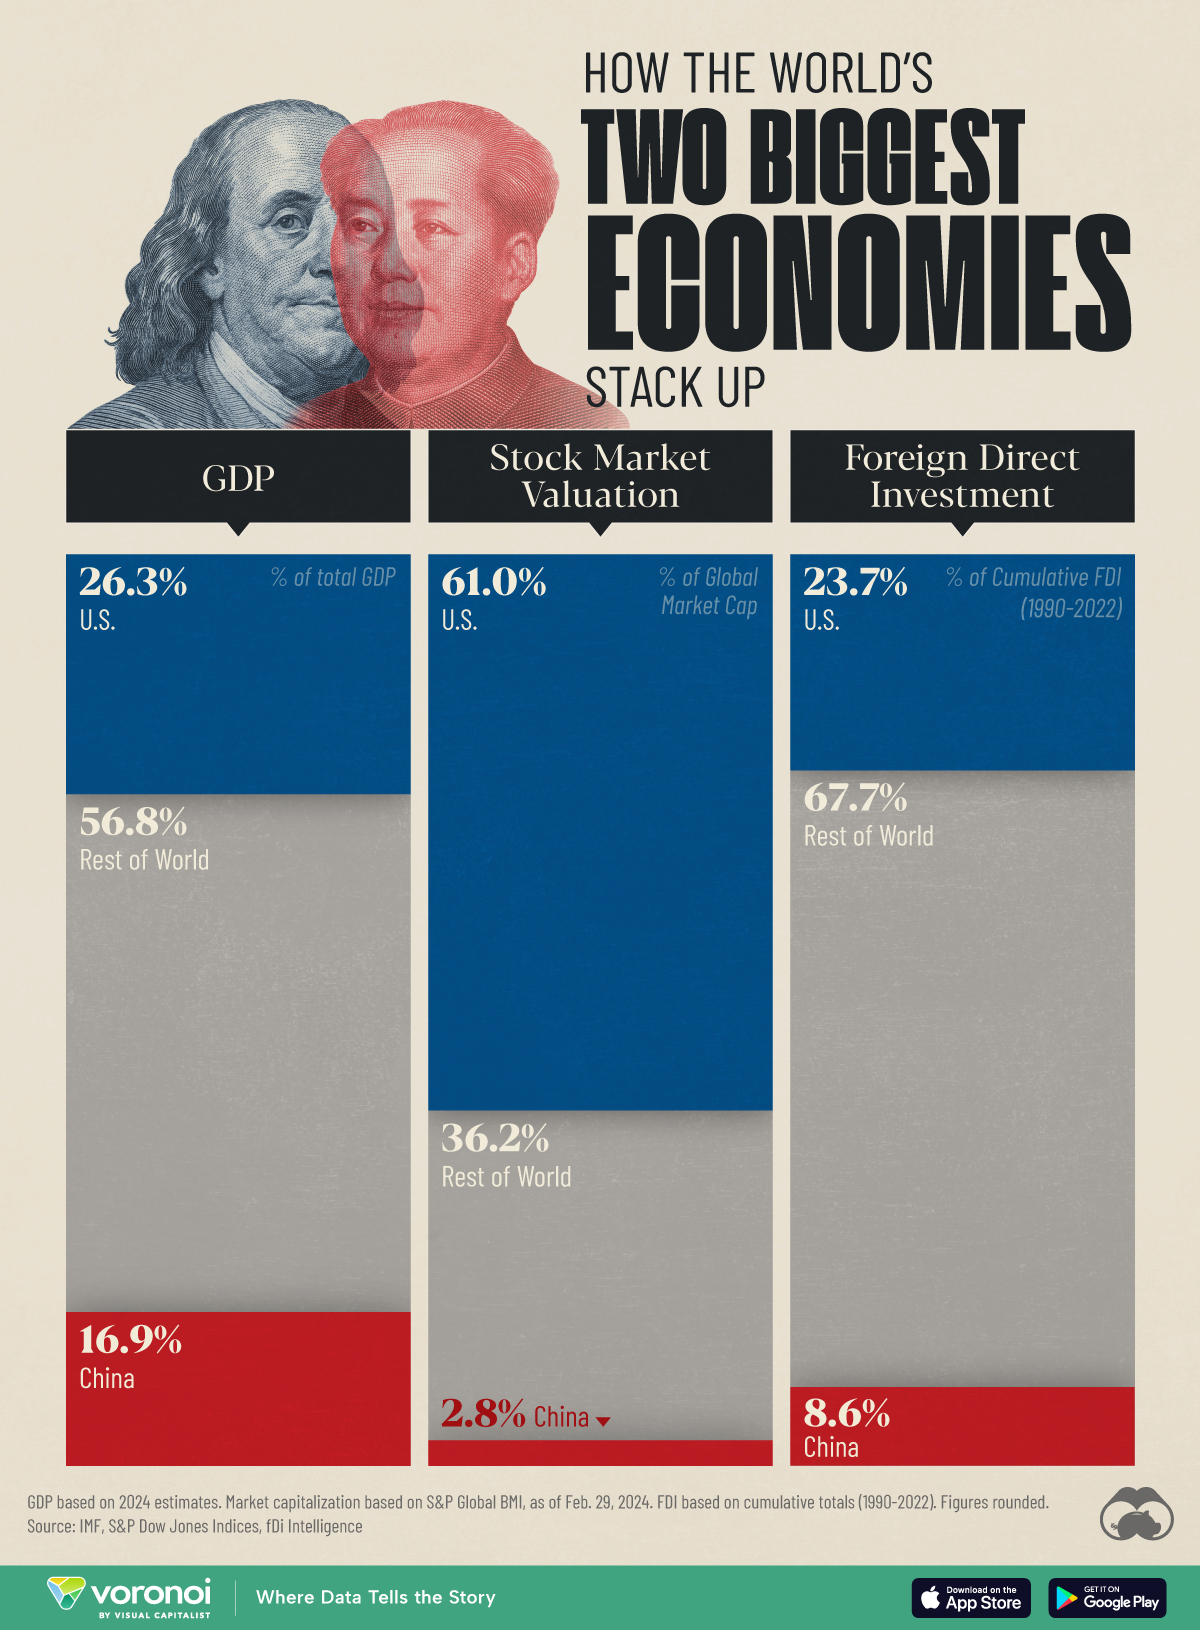

Comparing the Economies of U.S. and China in 3 Key Metrics
This was originally posted on our Voronoi app. Download the app for free on iOS or Android and discover incredible data-driven charts from a variety of trusted sources.
In this graphic, we provide insight into the world’s two biggest economies by comparing them across three key metrics: GDP, equity market valuation, and foreign direct investment (FDI).
Starting with GDP, we used 2024 estimates from the latest edition of the IMF’s World Economic Outlook (April 2024):
| Country | GDP (% of total) | GDP (USD billions) |
|---|---|---|
| 🇺🇸 U.S. | 26.3 | $28,780 |
| 🇨🇳 China | 16.9 | $18,530 |
| 🌍 Rest of World | 56.8 | $62,220 |
Based on these figures, the United States and China combine for a massive 43.2% share of the global economy.
It’s also interesting to note that America’s share of global GDP has actually been increasing in recent years, from a low of 21.1% in 2011. This is partly due to its relatively strong recovery from the COVID-19 pandemic.
Equity Market Valuation
The U.S. dominates when it comes to stock market valuation, accounting for 61% of the global total as of Feb. 29, 2024. These figures are based on each country’s share of the S&P Global BMI, which is a broad coverage index, including large, mid, and small-cap stocks from developed and emerging markets.
| Country | % of Global Market Cap |
|---|---|
| 🇺🇸 U.S. | 61.0 |
| 🇨🇳 China | 2.8 |
| 🌍 Rest of World | 36.2 |
The massive disparity in equity market valuations between the U.S. and China is a result of differences in many factors, including market maturity, corporate governance, and international participation.
In terms of country rankings within the S&P Global BMI, China is the fourth largest (behind Japan and the UK).
Foreign Direct Investment
FDI is an investment made by a firm or individual in one country into business interests located in another country. This type of investment can be very beneficial because it can create jobs and enhance economic growth. The FDI figures in this graphic were sourced from fDi Intelligence, and represent cumulative FDI stock from 1990 to 2022.
| Country | % of Global FDI | FDI (current USD) |
|---|---|---|
| 🇺🇸 U.S. | 23.7 | $10.5T |
| 🇨🇳 China | 8.6 | $3.8T |
| 🌍 Rest of World | 67.7 | $30.0T |
The U.S. and China are first and second in terms of cumulative FDI stock. Attracting FDI is one area where China has performed very strongly in recent years.
For example, in 2012, China had attracted $950 billion in FDI, good enough for sixth place. As of 2022, China’s total had grown to $3.8 trillion, a testament to its attractiveness to global businesses, even in the face of regulatory challenges and geopolitical tensions.
Learn More About the Global Economy From Visual Capitalist
If you enjoyed this graphic, check out this graphic ranking the world’s biggest stock markets by country.

-

 Misc7 days ago
Ranked: Top 10 Deadliest Animals for Humans
-

 AI2 weeks ago
Nvidia is Worth More Than All of These Companies Combined
-

 Stocks2 weeks ago
Visualizing Berkshire Hathaway’s Stock Portfolio (Q1 2024)
-

 Markets2 weeks ago
The Top Retailers in the World, by Store Count
-

 Crime2 weeks ago
Top 10 Most Stolen Vehicles in America
-

 Education2 weeks ago
How U.S. College Students Feel About Their Finances
-

 Technology2 weeks ago
What Laptop Brands do Americans Use in 2024?
-

 population1 week ago
Mapped: Chinese Provinces With Cities Over 1 Million People